

HCP module · Risk and HACCP
Ingenes HACCP — supervision of food safety inspections
Control points in the plant structure, an automatically generated inspection schedule, result capture at the workstation and measurement trends with process capability indices. Instead of a spreadsheet that finds out last.
Module capabilities
What the module is built on
Six configuration elements from which the system derives the entire inspection plan and the entire content of each inspection. You set them up once, during rollout.
Plant structure and control points
A Plant → Department → Process → Line → Control point hierarchy. A control point attaches either to a line or directly to a process — for example a cold store not tied to any line.
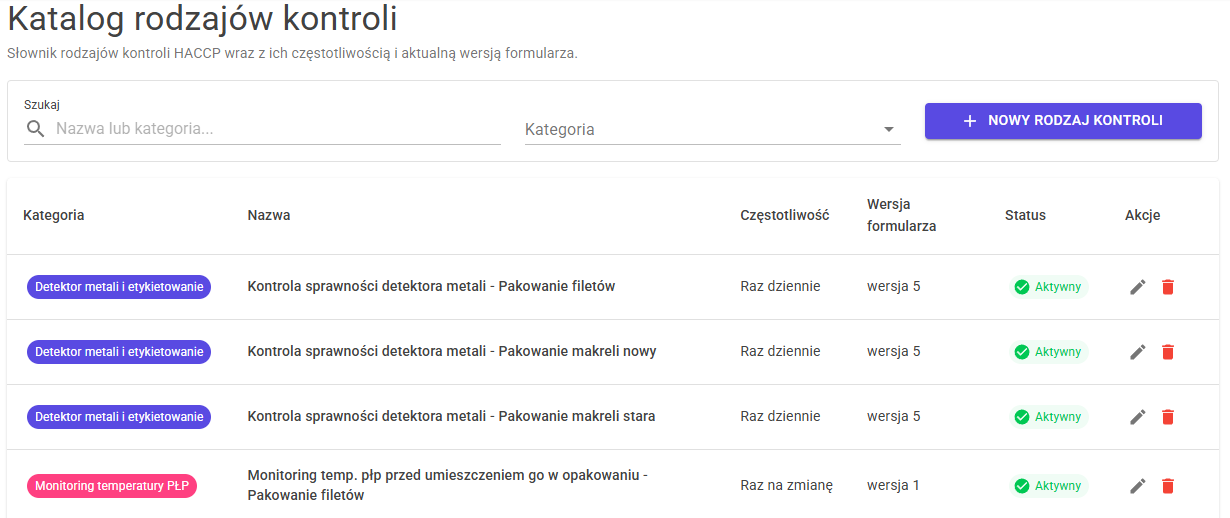
Inspection type catalogue
A dictionary of HACCP inspection templates: what to inspect, how often and against which form. Frequencies range from hourly to annual, plus ad-hoc inspections.
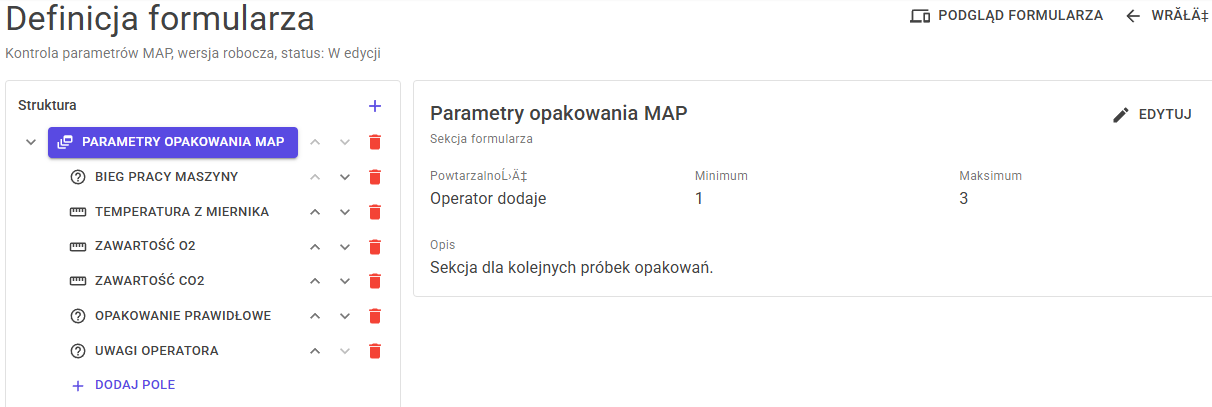
Versioned inspection forms
A form is built from sections and fields, and publishing locks its structure. New versions are created by cloning — the history of completed inspections stays consistent.
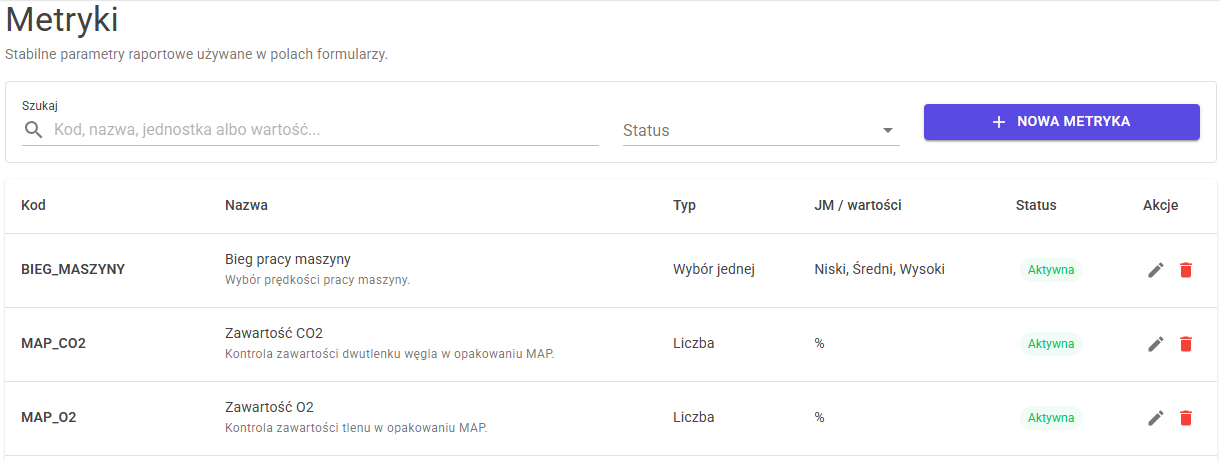
Metric dictionary with tolerances
Measurement parameters (temperature, %O₂, CO₂, pH) defined once, with a nominal value and −/+ tolerance. The same parameter from different forms lands on one trend chart.
Automatic inspection plan generation
You do not hand the system a list of inspections — you give it the rules: control points, frequencies, work shifts and the production calendar. The plan derives itself.
Operators and their availability
Holidays, absences and temporary shift changes are honoured when assigning inspections. Unstaffed inspections show up immediately as “No operator”.
Features · Planning
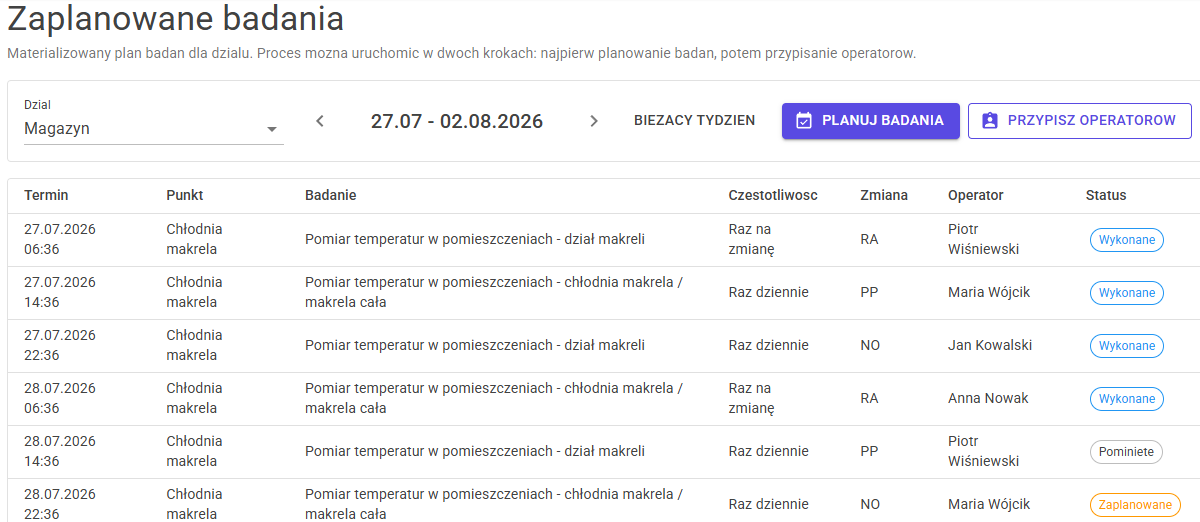
An inspection plan that assembles itself
You do not hand the system a list of inspections to perform — you give it the rules. The plan derives itself from control points, frequencies and the shift calendar.
Features · Execution
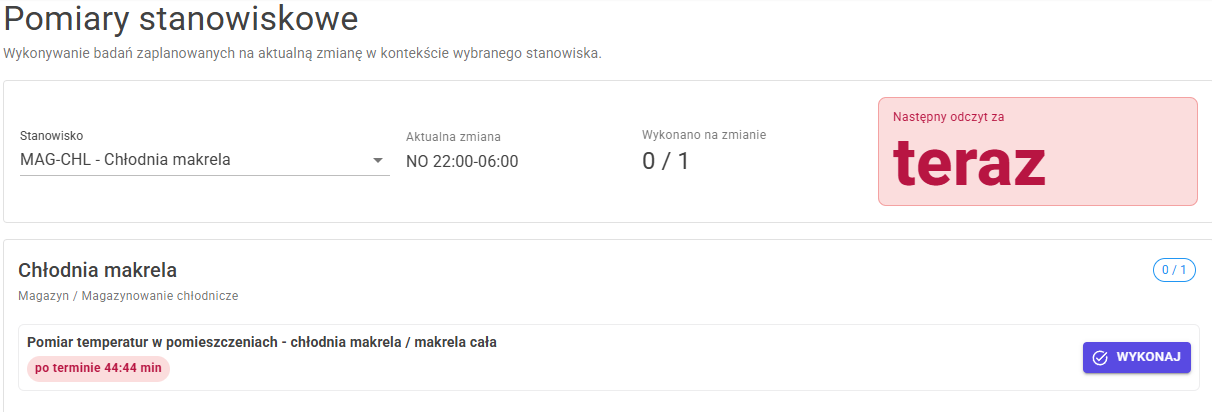
Capture inspections where they actually happen
An operator records a result from the dashboard, from the schedule or from the workstation screen — always on the same form, in the version in force at the time of the inspection.
Features · Supervision and analysis
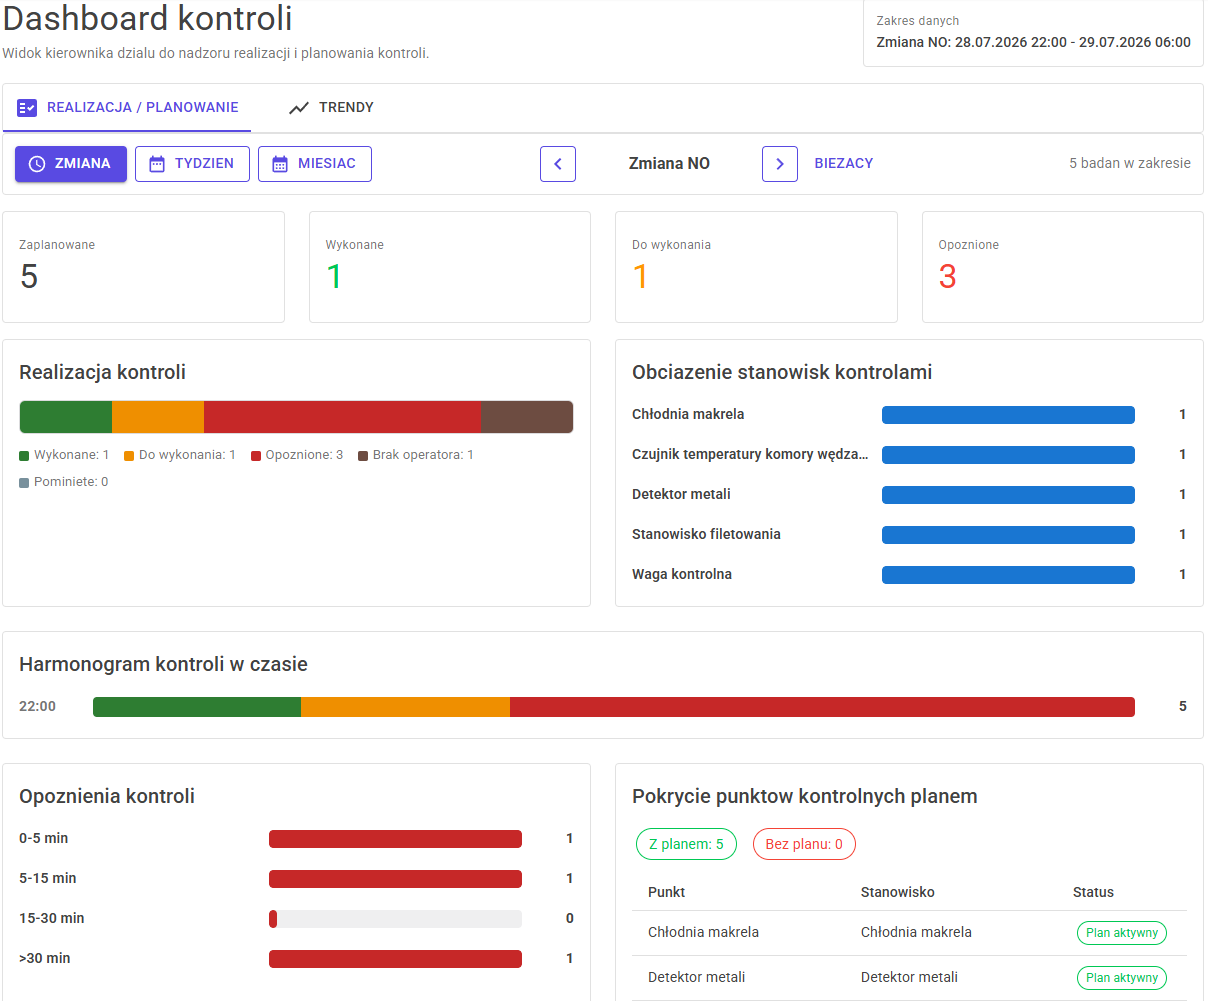
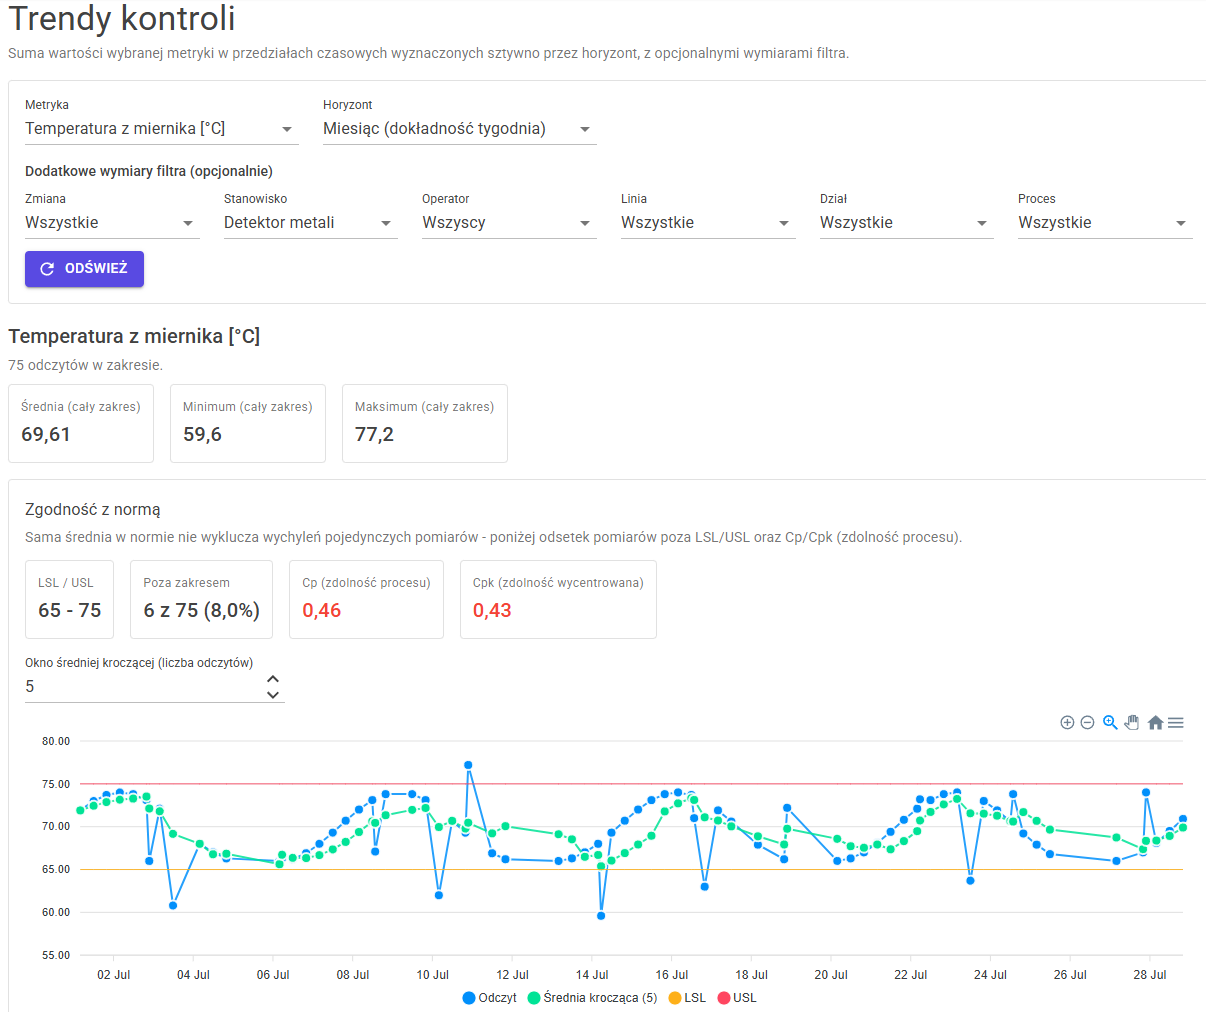
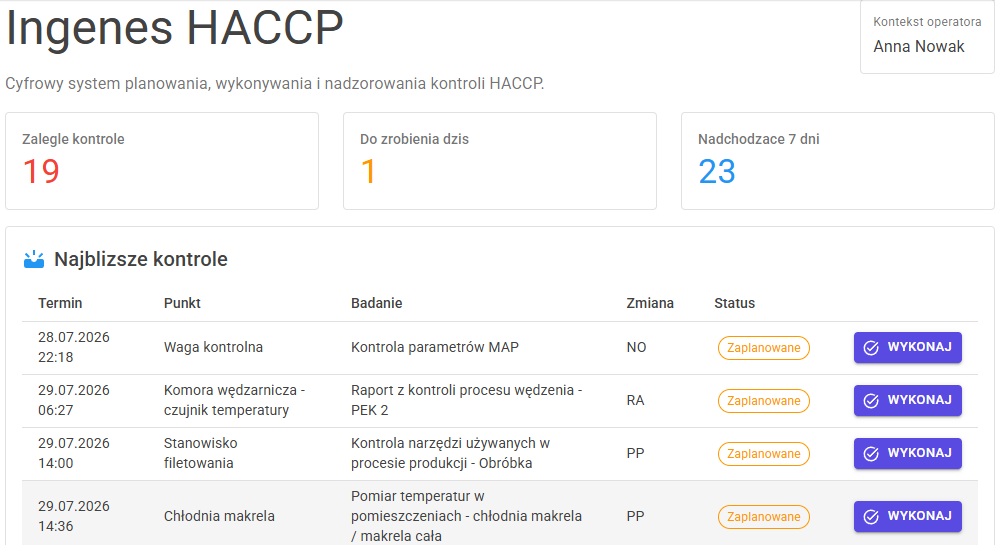
Execution dashboard and measurement trends
A manager sees execution across the chosen range — a shift, a week or a month. An analyst puts readings of one metric from many forms onto a single chart.
Module screens
What it looks like in practice
Screens from the running module on demonstration data from a fish processing plant, shown with a Polish interface. Click to open at full resolution.
Benefits
What changes after rollout
A spreadsheet does what it can. The problem is that the work a tool should be doing is redone by hand, by someone in your company, every week.
Peace of mind before an audit
A complete, timestamped history of completed inspections together with the form version in force at the time. No reconstructing documentation the day before an audit.
No more manual scheduling
The work someone in your company redoes in a spreadsheet every week stops being anyone’s job and becomes the output of recalculating the rules.
Overdue work visible immediately
Overdue, today’s and upcoming inspections on a single dashboard — a supervision gap shows up the day it appears, not at the audit.
Early detection of process drift
Every single reading plotted against the tolerance band with a moving average. You see the direction of change before a parameter crosses the limit.
A sound read on stability
An average within limits does not mean the process is stable. Cp and Cpk show whether the process is tight enough and whether it is centred.
An automation you can trust
Every planning run leaves a log: what was added, what was skipped and why. Automation whose decisions can be checked.
Rollout
Six steps to your first inspection plan
The order follows the dependencies between the data — you cannot publish a form without metrics, or create a control point without the plant structure.
Shifts and production calendar
Work shift codes and hours, public holidays plus additional non-working and working days.
Metrics
A dictionary of measurement parameters with units, nominal values and tolerances.
Plant structure
The Plant → Department → Process → Line → Control point tree together with workstations.
Inspection catalogue and forms
Inspection types with frequencies, plus forms built from sections and fields — published at the end.
Operators and availability
The list of people performing inspections along with availability, temporary shifts and absences.
Horizons and plan generation
How far ahead the plan is generated for each frequency, followed by assigning operators to inspections.
See the HACCP module on your own inspections
We will prepare a demo based on your inspection register — with your control points, frequencies and forms.